“Bad cycles” in a MiSeq run
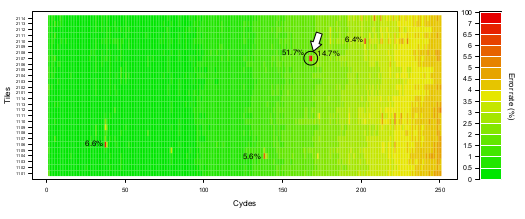
This plot summarizes the empirical tile- and cycle-specific MiSeq error rates based on reads covering the ΦX174 control template. In this run targeting small HIV RT amplicons, there were unusually high error rates (labelled directly on the forward-reads plot below) affecting a small number of tile-cycle combinations. Bases corresponding to these bad cycles were not flagged by Illumina’s MiSeqReporter software with low quality scores.
These bad cycles will systematically affect all amplicon-based samples in a run. One cycle in particular caused significant overestimates in the frequencies of E138A (which decreases susceptibility to some NNRTIs) in the samples being processed in this run for resistance genotyping.
Revision to the MiSeq pipeline in Kive
In response to the observation of “bad cycles” in MiSeq control data, we developed a filtering method that discards these cycles on the basis of empirical error rates as determined from reads covering the ΦX174 control template.
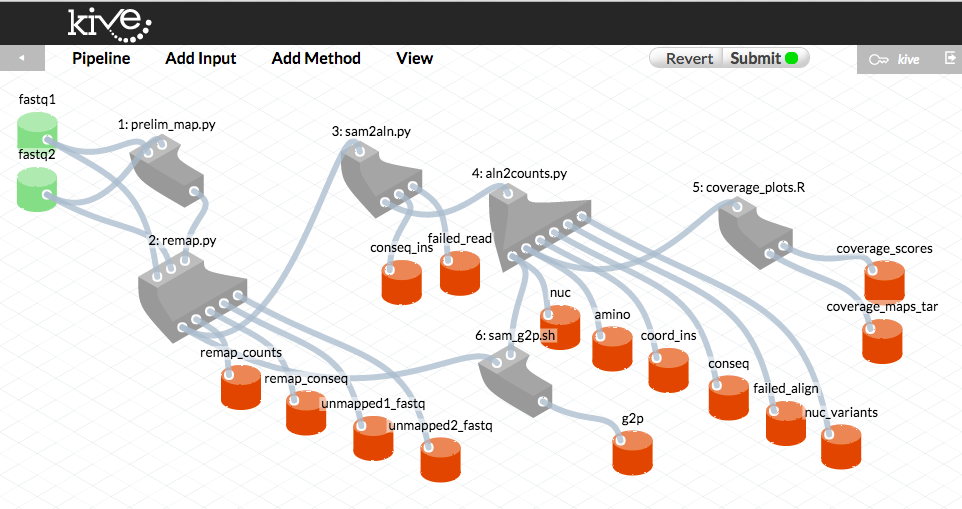
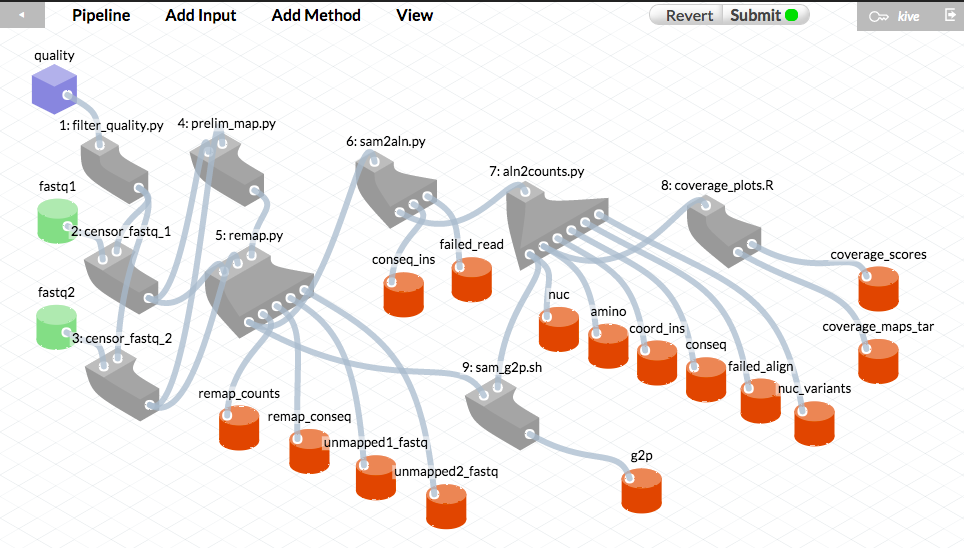
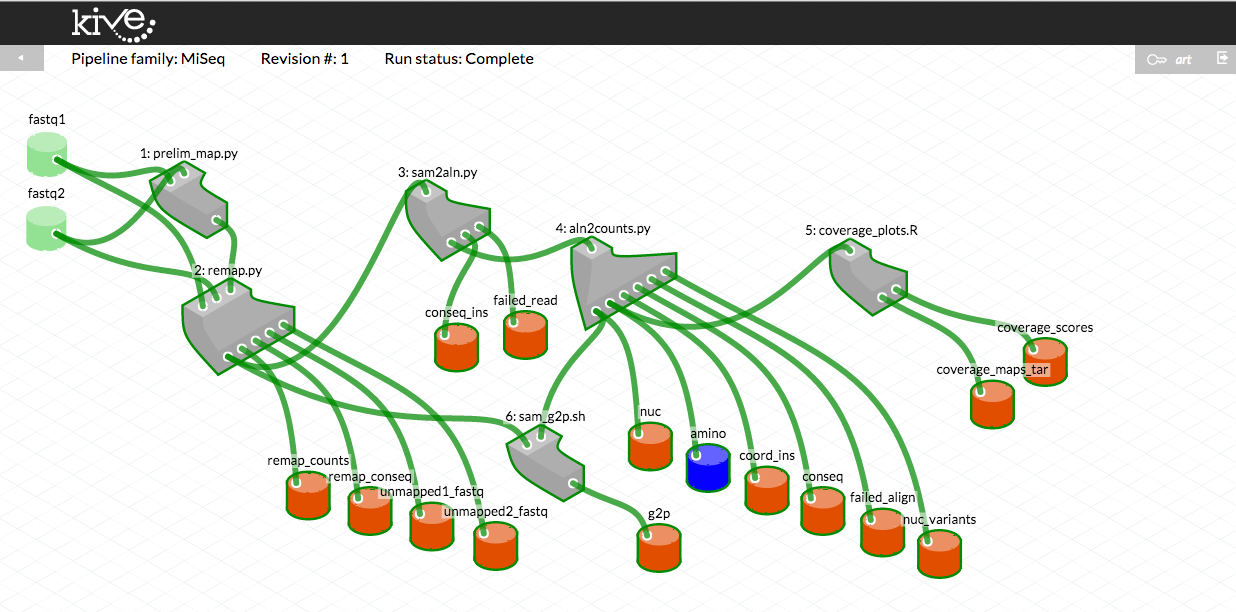
These screen captures illustrate how pipeline versions are presented to the user in Kive. These diagrams correspond to MiSeq pipeline versions 6.6 (top) and 6.7.3 (bottom, with error rate filtering), respectively. Grey shapes represent “methods” - bioinformatic scripts that comprise the pipeline. Green cylinders represent raw data inputs. Blue cubes indicate “structured” data inputs (data written in a predefined CSV format with specific variable types). Red cylinders represent the pipeline data outputs.
Retrieving a pipeline history in Kive
When the user “drags” a pipeline output file into the web browser window, Kive displays (see screen capture below) the raw inputs and the exact version of the pipeline that produced this output (highlighted in blue) based on that file’s md5 checksum. This history is permanently recorded in the Kive database.
Outcome of pipeline revision
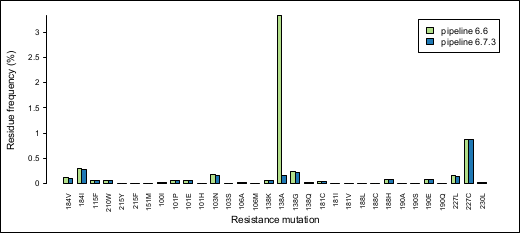
This barplot depicts the observed frequencies of amino acids that are associated with resistance to NRTIs or NNRTIs within HIV RT codons 90-234 (HXB2 coordinates; drug resistance associations according to Stanford HIV Database). These frequencies were generated for a single pNL4-3 clonal sample processed with pipeline versions 6.6 and 6.7.3. This clone has HXB2 “wildtype” residues at all listed positions. Thus, any minority variant frequency should reflect experimental or bioinformatic error.
We observed >3% prevalence of E138A in this particular sample for pipeline version 6.6. However, applying the empirical error rate filtering in version 6.7.3 substantially reduced this frequency.